Title
A study into the effectiveness of measurements and management processes for controlled customer ingress at non-turnstile events based in the United Kingdom
(Working With Crowds Edit)
Author, Mark McQuade
2nd May 2017
A dissertation submitted in partial fulfilment of the requirements for the degree of BA(Hons) Crowd Safety Management
Acknowledgements
Returning to further education as a mature student, was a daunting process and not taken without due care and consideration. Without the support of those around me I would not have completed the course and gained an experience that was mentally challenging, emotionally draining and one that I will never regret taking. I hope to pass this on to my children and encourage them to never stop pushing themselves to the goals they want to achieve.
To my loving wife Paula, thank you for the support both emotionally and financially to achieve what I needed to complete. To my children; Aidan, Liam and Niamh, for loving and missing me when I was away from home and forgiving me for the time daddy had to spend doing his homework. For my mother and father; Catherine and Peter, and the support you provide when times are tough, hopefully I have made you proud. To my sister; Lynsey, for pushing me on and showing me what can be achieved with your inspirational pursuit of further education.
I would like to thank my employer; G4S Secure Solutions, for their financial support in the first two years of the course. To my colleagues for putting up with my long winded and boring monologues about crowd management. To those around me at work, thank you for letting me conduct my studies and observations and assisting me with the information and research results for this dissertation.
Finally, I would like to thank all those involved in the provision of the Crowd Safety Management course at New Buckinghamshire University. Without you all I would be annoying a lot of people, asking questions about crowds. Especial Dr Mick Upton, Mark Hamilton, Owen-Granger Jones, Emma Parkinson, Phillip Wood and the course lectures. The time and effort you put into the course was appreciated.
Abstract
The publication in 1973 of the first Guide to Safety at Sports Grounds (DCMS, 2008). and subsequent updates; have provided ingress rates for turnstile operation throughout the versions. The Event Safety Guide, from its original incarnation; a guide to health, safety and welfare at music and similar events (HSE, 1999) to the now online version (thepurpleguide, 2017) refers users to the Green Guides rates. The guide provides vague suggestions in relation to ingress for entrances out with a turnstile system and how to adjust the ingress rates. How do practitioners gain reliable calculations on ingress other than sports venues and the management methods required?
This study looked at the efficiency of current practices with the prospect of achieving a representative set of measurements for ingress calculations out with a turnstile operation and management solutions required to achieve these measurements.
Previous research of ingress calculations has been conducted; such as Upton (2007) for an outdoor event in 2004 and Kemp et al (2007) for a 2005 event. For this study a comparison between the findings of previous study, observation of live events and controlled experiments would be conducted. Walliman (2011) describes this evaluation of information as “making judgements about the quality of objects or events. Quality can be measured either in the absolute sense or on a comparative basis”. This study will provide ingress rates for entry systems, security protocols and the influence customer service has on ingress, without using turnstiles; to compare with published guidance, the construction of something useful (Sharp et al. 2002).
Contents
Acknowledgments…………………………………………………………………………
Abstract…………………………………………………………………………………….
Contents……………………………………………………………………………………
Introduction…………………………………………………………………………………
Aims and objectives………………………………………………………………………
Literature Review………………………………………………………………………….
Understanding Ingress……………………………………………………………
Entry Systems……………………………………………………………………..
Security considerations…………………………………………………………..
Customer Service…………………………………………………………………
Methodology……………………………………………………………………………….
Potential outcomes and Limitations……………………………………………..
Capacity ingress…………………………………………………………………..
Focus group participants……………………………………………………………
Materials……………………………………………………………………………
Design………………………………………………………………………………
Ethics……………………………………………………………………………….
Results………………………………………………………………………………………
Entry Systems……………………………………………………………………….
Security considerations…………………………………………………………..
Customer service………………………………………………………………….
Combination………………………………………………………………………….
Discussion………………………………………………………………………………….
Referencing………………………………………………………………………………..
Appendix (Not included in Working With Crowds Edit)
A – Entry systems capacity data collection……………………………………..
B – Security consideration data collection………………………………………
C – Focus group study – Male searchers………………………………………
D – Focus group study – Female searchers……………………………………
E – Ethical consent form Buckinghamshire New University…………………
Introduction
The first Guide to Safety at Sports Grounds was published in 1973 and subsequent updates; with the most current being the Fifth edition (DCMS, 2008) and the Sixth edition due to be published in 2017 (SGSA, 2016). This was followed by the Event Safety Guide, from its original incarnation; a guide to health, safety and welfare at music and similar events (HSE, 1993) to the now online version (thepurpleguide, 2016). Together, they provide a crucial understanding of event safety planning within the United Kingdom and perhaps the most referred to guidance by event and crowd safety managers.
This study will focus on the effectiveness of measurements and management processes, for controlled customer ingress at non-turnstile events based in the United Kingdom. The Guide to Safety at Sports Grounds (Green Guide), specifies an upper limit capacity of 660 persons per hour (DCMS, 2008, p61) passing through a single turnstile; were as, The Event Safety Guide (Purple Guide), advises to refer to the figures provided in the Green Guide. This would appear to be an ambiguous explanation to a critical stage on an events timeline, with limited adaptation for entry systems out with a stadiums turnstile operation.
Stadium turnstile systems deliver a mechanical, control measure to ensure the safe entry of customers into an event (Skidata, 2017) and guidance (DCMS, 2008, p62) provides through-put rates to attain. Without the use of a turnstile system for ingress, the variations can be numerous; entrance doors to a club or arena, temporary lanes created for a festival site, street event or supplementary entrances for a sports stadium when used for concert (Health and Safety Executive, 1999, p159); controlled by nominated persons. The variations to the stages of ingress out with a turnstile system, could be considered the reason that a clear methodology has not been provided. To understand how effective and representative the current guidance is; when relating to customer ingress for events out with a turnstile operation, an appreciation of the ingress process, would be required.
For this study; ticket exchange, security protocols and customer service, form the entry stages to a contemporary event space; in some arrangement. Respectively, the variances (O’Gorman & MacIntosh, 2014, p183) and validity (Blaxter et al, 2006, p221) will be included for deliberation.
Each of the three proposed stages can influence the through-put rates during ingress and the management required of the ingress. Event ticketing can be as humble as basic printed tickets; unique to the event, to complex ticket printing methods including security features (ticketprinting, 2017) and entry control features. Failures or interruptions in this system can reduce through-put and prolong queueing times (BBC News, 2016).
Security at events, is conceivably the focus of the customer entry process currently. The national threat level for the United Kingdom (MI5, 2017), has been set at severe since 29th August 2014; with crowded events, likely targets for terror attacks. Attacks have been witnessed across Europe in recent years; a vehicle attack killing 12 persons and injuring 56, at a Christmas market in Berlin, Germany (Huggler et al, 2016); a vehicle attack killing 87 persons and injuring 434, at a street event in Nice, France (Henderson & Sabur, 2016); an attack on the Stade De France and Bataclan Theatre, killed 136 persons and injured 368 (BBC News, 2015). The introduction of additional security measures can increase queuing and diminish ingress flow rates; described latterly at music festivals (IQ Mag, 2016), international sporting events (BBC News, 2016) and major transport hubs; such as airports (BBC News, 2016).
The final stage; and perhaps the most underrated, is customer service. Event providers realise that security and stewards provide one of the largest customer facing (walker, 2006) resource. Returning customers and positive feedback or opinions on social media (Williams, 2012), develop and augment an events longevity; negative or disparaging feedback and opinion (Eggemeier, 2016) can have the contrary effect. Security providers realise the responsibility of being feasibly, the clients first contact with a customer for an event and include customer service training for their staff (Bukowski, 2015).
Aims and objectives
Were, the study denotes variations in measurements; a clarification of the results will be offered, with the prospect of attaining additional representative measurements for ingress and management solutions. A practical outcome for the study is provision of supplementary, accurate measurements and methodological solutions for planning of events; the construction of something useful (Sharp et al. 2002, p.14).
To allow a study to be conducted, an understanding of what is involved in a study is necessary; Swetnam (2004, p.11) proposes that “From an amorphous, vague idea must emerge a sharp, precise plan”. Along with sharpening, comes a requirement to set limitations to the study. Sachdeva (2009, p15) recommends that documenting the scope and limits of the study would be prudent and are identified in the study’s methodology.
Literature review
To achieve an understanding of the stages of event ingress; ticket exchange, security protocols and customer service, a review (Veal, 2006, p131) of earlier analyses and research is necessary, to permit pertinent and attainable inquiry.
Understanding Ingress
As touched upon in the introduction to the study, The Guide to Safety at Sports Grounds (Green Guide) (2008), provides ingress through-put rates for admittance; with “the upper limit is set at 660 persons per turnstile (or other entry points) per hour” (DCMS, 2008, p61). The addition of “other entry points”, allows The Event Safety Guide (Purple Guide) (1999) to reference as, “gives flow rates applicable to sports stadia” (HSE, 1999, p21). Along with this there is mention of “type, design and width of entrances and whether searching takes place.” (HSE, 1999, p21). This is similarly, referred to in the Green Guide, when considering factors that can affect entry through-put. It can be suggested that referring between both guidance, could lead to misunderstanding however.
Clarity was sought in 2014, when The Event Safety Guide, transferred to an online platform; replacing the traditional printed guidance. Depiction of the ingress process was enhanced, with additional information offered; comprising a descriptive flow chart (thepurpleguide, 2017, 3.14 Fig1). Although the approach was improved on previous publications, there is still ambiguity on through-put rates during ingress; out with the figures provided by the Green Guide.
The importance of ensuring that the ingress stages of an event are well planned, is highlighted by Upton (2007, p111), through his investigation of a fatal crowd related incident during the ingress stage of an event. As detailed by Upton, the intention was to hold a rock concert in Arad, Israel, 1995, on a temporary event space; for 18000 persons, were the entrance had to be devised and assembled from barriers and fencing. Although, the 2 fatalities, were through crowd density and a breakdown of control and management processes; Upton concludes that this is partly caused through “a lack of knowledge of pedestrian flow plan” (Upton, 2007, p118). There was no ingress flow calculations or pedestrian flow calculation, provided for the investigation; suggesting that they may never have been considered. Although, many other factors influenced the fatal incident; through-put rates compared to arrival rates failed, allowing a build-up of crowd density and subsequent loss of control and resulting fatalities.
Unlike Upton’s posthumous investigation, there were several case study’s conducted between 2003 and 2005 (kemp et al, 2004; Kemp et al, 2007) on crowd management operations at mass gathering events within the United Kingdom. As part of the analyses, the flow rates; or as previously described, through-put rates, was observed and rates recorded at peak ingress times. As well as the information gathered at the sites, the opportunity to review the planning stages for the events and the methodology behind the ingress planning stages was possible.
The planning for an event in 2003; Milton Keynes, allowed for 20 people per minute (ppm) to pass through the entrance points (Kemp et al, 2004, p24). The methodology for this was based on information from the Yellow Guide; Guide to Fire Precautions in Existing Places of entertainment (HMSO, 1990). Within the guidance; a rate of 40ppm, is provided for a “file” (HMSO, 1990, p44) can pass through an opening of 525mm (1-unit width). For the event in Milton Keynes, entrance lanes of 2-unit widths were fashioned; to allow persons with bulky items to pass through; though a single file would be maintained. Kemp et al (2004, p24) conveys that the flow rate, would also be reduced by 50%, to 20ppm. This was to allow for “a reduced pedestrian speed” (Kemp et al. 2004, p24), due to a three-stage ingress system; ticket check, a search and ticket take.
Kemp et al, also comment that for the development stages, “the purple guide offers only general advice on the design of pedestrian flow systems” (2004, p24). To gained guidance on entry calculations, reference to the Yellow or Green guides should be sought. It was decided at the planning stage to discount advice provided by the Green guide, as this was “primarily aimed at architecturally designed sports grounds with turnstile facilities” (Kemp et al, 2004, p24). What is not clarified though, is the flow rate from the Yellow Guide (HMSO, 1990, p44), is derived from calculations for “Exit capacity”. The reduction in flow rate, has no other reasoning apart from the three ingress stages and having bulky items.
In 2005, another event was held and studied on the same site; were comparisons can be sought. Kemp et al (2007), provide a detailed crowd management plan for the event and the methodology for pedestrian flow calculations. As with the 2003 event, a flow rate of 20ppm (Kemp et al, 2007, p118), was planned upon; with additional safety contingencies as a precaution. Compared to the 2003 event; the detailed description of the ingress calculations and design, there are only 2-stages of ingress management. There is the ticket taker and a searcher; the removal of one person from the 2003 event, though the flow stands comparable. There is a possibility that the 2005 event made use of the precedence set by the 2003 event.
Although, the 2005 event was not studied in operation to measure the delivery of the planned rates, there was an event studied in 2003 at Knebworth (Kemp et al, 2004; p34 – 42). As with the event earlier in the year at Milton Keynes (Kemp et al, 2004; p24), the pedestrian flow rate was planned for 20ppm per entry lane; this was not replicated in the figures collected over the 3 days of the event. Results show ingress at a peak of 13ppm on day 1; 13ppm on day 2 and 15ppm on day 3 for each entrance lane.
Observations at an event in Trafalgar Square; 2005, again proposed that the pedestrian flow of 20ppm per lane was attained. This figure was provided as “measured by diverting groups of ten persons to one lane for a period of 30 seconds” (Kemp et al, 2007; p 78). Along with this observation comes a computer recording of collected attendance figures over set intervals during ingress. This would seem to contradict the on the ground collection of pedestrian flow; presenting 7.5ppm per lane (Kemp et al, 2007; p66).
On review of publicly available crowd management plans, appear provide variations on the documented pedestrian flow rate calculations during ingress. Abeluga (2012), plans for 480ppm per lane over 1 hour; or 8ppm. For a 2014 event, 5ppm per entry check point was provided (Main Event security, 2014). For events in 2015 and 2016; by the same security provider, a rate of 3ppm per lane is provided (Vespasian Security, 2015, p8; Vespasian Security, 2016, p9). The rate has been reduced to account for ingress of campers at a music festival and the volume of bags they will have. Throughout the plans, there is no mention of methodology or referencing; possibly because there is limited information available on how to achieve a relevant calculation and rational.
Still (2013) delivered his introduction to crowd science; the stages and core teachings and concepts. In relation to Ingress, this is described as “how the crowds arrive and enter a site” (Still, 2013, p7). Further expanding on the importance of pedestrian flow on ingress (through-put), as failure to process the arriving customers can lead to a build-up in crowd density (Still, 2013, p60, p163, p178).
To assist in planning for an event; including the ingress stage, Still, provides two models for use. The first is a “RAMP Analysis”; and acronym for Routes, Arrival, Movement and Profile (Still, 2013, p152). Through the analysis, the planner must consider all the information and influences in relation to the crowd. For ingress (arrival) this could include; ground conditions, entrance facilities, lighting, ticketing system, Wi-Fi reliability, arrival profile, weather, lighting and security protocols to name but a few. As individual elements, there may only be slight variations to entry time; but combining them together can lead to significant changes.
The second method; working alongside the first, is the DIM-ICE meta-modelling, “a template for events that focusses the user’s attention in the time-related element of crowd risk” (Still, 2013, p118). An acronym for Design, Information and Management, during the Ingress, Circulation and Egress, stages of an event. As, Still, describes the user should consider the elements that make up the first three parts, in relation to the three main stages of crowd movement within an event. This allows the elements of risk to be considered. When considering ingress; Design; layout of barriers and queueing system for ease of flow, sufficient stewarding and security, efficient ticketing system, suitable ground conditions or cover in case of inclement weather. Information; opening times, restricted items for security, were to arrive, transportation links or routes. Management; stewarding and security positions and numbers, queue management and way finders and ticketing system use. Through, following the stages of the meta-model, the user should have deliberated all influences and solutions.
The introduction of crowd science, also included the on-going interest of computers to model crowd movement; computer designed models that simulate an environment and how people interact with that environment. To make these systems relevant, they must be realistic and follow the conditions observed in the real world.
Research in the use of computer simulations, should not be overlooked by planners out with modelling, as the concepts are based on researching the real-world environment. Strege & Ferreira (2014), discusses the risk involved in introducing a new entry system to a secure building. Suggesting that “assuming a constant throughput rate, based on manufacture or laboratory data, provides optimistic estimates close to a best-case scenario” (Strege & Ferreira, 2014), shows a realism of concept in “bursts and lulls”, when considering arrival profiles.
With the modelling of large scale events, small variations will have the same influences on the simulation as would be seen in the real world. Könnecke et al (2014), consider this when simulating ingress; for a turnstile system in this case. Informing that “The average flow of 12 persons/min for ticket control with a turnstile can be reproduced” (Könnecke et al (2014) and can allow the design of complex scenarios. They refer to the previous research of Fischer et al. (2004), when considering the variations in through-put rates; rates vary depending on requirements, bag checks, application of wristbands and other variables.
Along with the computer modeling, there is research on queuing in other industries; such as patient care and the built environment. In studies of queues, part of the process is consideration for the through-put rate; the slower the rate, the higher the likelihood of queues forming and growing. In their case study involving queues and patient flow in emergency departments, Vass & Szabo (2015), relating to Erlang’s (1909) queueing theory. They also introduce the characteristics of Yasara’s (2009) queueing model. If we were to relate this to crowds; the number of servers (deployment of security and ticket checkers), their arrival pattern (the rate of customer arrival and volume), service patterns (variation on customer needs – male, female, bags and jackets) and queue discipline (the systematic processing of customers through a queue system for greater efficiency).
Arita & Schadschneider (2014), follow the same process in presenting on queueing, referring to Erlang (1909) and how this was applied to other fields; including the work of Medhi (2003), Saaty (1961), Hopp & Spearman (2008) and Arita & Schadschneider (2014). Although all studies are on separate fields, they all relate the through-put rate, to be an essential part of the queuing process; were inefficient or ineffective through-put will impact of queueing times and lengths.
In separate research pieces into airport security and screening, Ellas (2009) and Schell et al (2003), present on the importance of through-put rates at the point of screening. Schell et al, illustrate that an “increase in screening capacity would completely eliminate the line and wait time. Increased capacity at ticket counters would have similar effects”. Ellas (2009), examines the ratio of service points and rate of through-put in relation to the peaks and lulls of arrivals. Advising were by matching the service level to arrival can efficiently process the arriving customers and reduction of queuing time.
Following on from understanding the importance of ingress through-put rates and the reasoning for these rates, focus can be sought on key areas of the ingress process.
Entry Systems
On review of publicly available material on electronic ticketing entry systems and their use, it has been considered that most the information is based on the sale and features of the available systems. This cannot be considered as impartial (Walliman, 2011) and the limited information would be disclosed in the systems rates and efficiency due to commercial sensitivity. The decision to conduct impartial testing of a system to provide accurate information has been taken.
Security considerations
Within the United Kingdom, the provision of private security is regulated by the Security Industry Authority (SIA, ND), under the terms of the Private Security Industry Act 2001 (legislation.gov.uk, ND). Although this study considers all components of ingress, the highest percentage of security will be provided by private security companies. For this reason, it would be prudent to understand the training provided.
To assist in an understanding of the 2001 Act, the SIA provide guidance and learning outcomes for security training. Clarity is provided to the reason for searching customers entering an event; “Note if the purpose of searching of persons or bags is to ensure that no-one with prohibited items enters the premises, then this is an activity that falls within paragraph 2(1)(a) of Schedule 2 of the Private Security Industry Act as an activity that consists of “guarding premises against unauthorised access”. (SIA, 2008). Were the search to ensure no dangerous items or weapons enter the event space, “then the bag searching would also fall within paragraph 2(1)(a) and potentially paragraphs 2(1)(b) and (c) of Schedule 2 of the Private Security Industry Act on the basis that this would be guarding property and individuals respectively against damage and injury.” (SIA, 2008).
The training provided to the private security companies that deliver searchers (door supervisors) for event, define the learning outcomes to be achieved for qualification to be a licenced security officer. These include, the ability to “demonstrate search procedures” and “State a door supervisors right of search, including ‘conditions of entry’ and the importance of obtaining permission to search” (SIA, 2014). The security officer should also be able to “state the hazards” of carrying out a search and how to search a person and their property.
Looking out-with the private security industry, the techniques and training of government lead organisations such as the police services and border control agents; in relation to the training provided to them, should be considered. Were a police search can lead to possible criminal conviction and the recovery of evidence, officers training details expectations and procedures in conducting a search of body or property. For the body this is separated vertically and horizontally at the belt line; creating four sectors. When considering clothing, “Clothing should be considered first, especially items contained within pockets or secreted in clothing seams, waistbands, belts, collars, hoods, lapels, padding, cuffs and turn-ups.” (Harrison et al, 2006). This is reflected in officer training in other countries; for example, in America “The search should be done in a systematic and thorough manner. There must be a logical sequence to the search or the searcher will miss something.” (BC Sheriff, 2003).
Were as police officer can have sufficient time to conduct a search of a person, there are other areas; like the events sector, where facilitating a search has a time constraint and high level of customer service. Elias (2009), suggests this is the case in the aviation sector and passenger searching (screening), During research on passenger screening, were the human element of the system; the workforce, are the “fallible and vulnerable element”. Elais, would suggest that this would be mistaken notion “This should not be construed as a reflection on the dedication and commitment of individual screeners to performing this critical job function. Rather it reflects a combination of the complex challenges faced by screeners, limitations in human perception and performance, resourceful adversaries who may employ artful concealment methods, and competing job pressures to accurately detect threat objects while maintaining an efficient flow of passengers through security checkpoints.” (Elais, 2009, p6). Along with this Elais, provides a list of influences on human performance that can be related to any sector carrying out similar duties “A variety of factors may contribute to these human performance limitations, including inadequate training, lack of motivation and job satisfaction, fatigue, and workplace conditions, as well as general human perception and performance limitations.” (Elais, 2009, p6). These influences would see a reduction in through-put delivery and quality of service. This is highlighted by Elais (2009, p19), when considering the balance of human accuracy when relating to the speed of screening (through-put). Suggesting, the quicker the process, the more likely that restricted of potentially dangerous items may be missed. Seidenstat & Splane (2009), suggest that screeners at airports have 30 seconds to conduct screening with an x-ray machine. Through experience of airports, is it possible to relate person screening to the same timescale; allowing person and belongings to pass through at the same rate.
To assist achieve the upper levels of through-put rates and level of service, airports have adapted to the needs of delivery and service to customers. Focus on the ingress stages at an airports screening area, assists with this delivery and can provide valuable insight into improving services in other sectors. The IATA (2010), have conducted study on this area and provided guidance to the industry. They have found that the provision of information on screening requirements and prohibited items; prior to arrival at the airport and on route to the screening area, increases through-put efficiency by 9%. This is also supplemented by pre-screening staff, to direct passengers to the required screening lanes; providing an orderly and efficient queueing system.
In the events sector, it is now common practise to pre-advertise terms and condition of entry. Although these vary from event to event, they have the same core information. For consideration, The Championships at Wimbledon (The All England Lawn Tennis Club, 2015) has been reviewed. A 21-page comprehensive guide to the event is available to all ticket holders. Information on security restrictions, prohibited items, travel information and maps, conditions of entry and frequently asked questions are included. Customers are encouraged to absorb this information prior to arriving at the venue, assisting in an efficient ingress process.
As with the customer information, the equipment used during customer searches can be various; hand held detection wands, walk through archways and x-ray machines, being provided by competing suppliers. A review of freely accessible company literature was undertaken for the study, by companies such as Rapiscan Systems (2017). The consulted product broachers, focus on the products design specification features, only on a few occasionally mentioning a potential through-put rate. As with any own company produced product information, were statistics on use are provided, it would be prudent to seek impartial substantiation.
Were security screening is required, the conduct of staff should be considered and a level of service provision defined. The U.S Customs and Border Protection (2015), provide a code of conduct for staff during screening of customers, “Searches must be conducted in a professional, thorough, and reasonable manner, consistent with the type of search required” (2015, p9). Physical contact with customers, requires high levels of professionalism to assist in developing customer service in a positive manner.
Customer service
“One of the things that is intriguing about Disney is the measures that they take to insure customer delight as opposed to customer service. This means going far beyond customers’ expectations and the call of duty to deliver something special.” (Cope et al, 2011). Quoting Bob Norton, Cope et al, inform us that the Disney corporation, realised that going beyond customer’s expectation, they would share their experience and increased the probability of return visits. Referring to comments made by Larry Lynch “Disney believed that it is the everyday interaction between Disney cast members and guests that genuinely makes the difference. Therefore, Disney has sought to continually enhance the customer’s experience” (Cope et al, 2011), Disney refer to their employees at their theme parks as,” cast members”, as they are all part of the Disney show and experience. This demonstrates a commitment to standards of delivery and innovation. Part of this innovation was embracing Erlang’s (1909) theory on queuing; where they realised the quicker and more efficiently you can service waiting customers the greater the experience they will have.
Within the United Kingdom events industry; although not to the same level as Disney, the adoption of customer service skills is being advices. The Health and Safety Executive (2000), published a guide to assist managing crowds safely, including building a relationship between staff and public. “People are more likely to be in a relaxed and contented frame of mind if they are effectively managed” (HSE,2000, p17) along with suitable facilities and information. They also refer to achieving a level of service and security that is accepted by the public “security searches or ticket checks which you might decide to do may be contrary to the ticket holders’ expectations. This could have the potential for the development of ill feeling, which could result in public order problems.” (HSE, 2000, p17).
There are events though that not all staff involved in the ingress process are from the same provider or paid employees; some may be through volunteer organisations. Getz (2007, p196) informs that this may lead to differing levels of service and experience in interacting with customers. This can also be said for paid staff, customer facing roles may not be there full time duty were supervision and training may be required in both cases. Getz, also introduces the idea of “stressors” (Getz, 2007, p223), were an adverse reaction to excessive waiting times (queueing) or overwhelming security may occur.
In discussing the subject of customer care, when selling security services, Wakefield (2003, p168) indicates the balancing of services involved in modern security provision. Seen traditionally as a secondary duty; primary being the security role, many security guards are a customer’s first point of contact and a customer friendly image is required. The management of customer relations is also touched upon by Hall et al (2012) for sports and special events. Presenting an understanding that good service and delivery assist in continued support and attendance which brings with it the economic benefits. This provision though is a fine balance between customer experience and “optimal security management practices” (Hall et al, 2012). The consideration of balancing security and customer service is also suggested of the aviation sector. Seidenstat & Splane (2009, p185) describe the “conflicting performance measures” that must be considered at the same time; the level of security compared to operational efficiency.
A more detailed explanation of customers’ expectations within the service industry is provided by Hudson & Hudson (2013). It is considered that in a competitive market, customers expect their needs to be “anticipated” and delivered. The customers’ expectations are based on previous experiences and similar situations. Where the service provider excides this level of service, the customer will accept this as a high level of service. Referring to Zeithaml et al (1993), three levels of expected service are suggested; desired, adequate and predicted, with “a zone of tolerance falls between the desires and adequate.” (Hudson & Hudson, 2013, p46). Desired, being wished for service, based on personal needs explicit and implicit promises from the service provider, word of mouth and previous experience. Adequate, is the minimum level of service accepted; based on perceived service alternatives. Predicted, is the level of service that customers anticipate receiving.
Through appreciation of each part of the ingress process and the combination of these parts, an understanding can be achieved for this study; of a suitable process and methodology.
Methodology
Following the literature review of the ingress stage at events and other sectors, considerations must be made to the best way to conduct this study.
Research into event based ingress has been the subject of previous studies, by Upton, 2007; Kemp et al, 2004; Kemp et al, 2007. As part of these studies, observers were instructed to gather rates of flow through ingress gates and information in relation to the entrance construction and management. Conducting a study 10 years after Kemp et al last publication, the study aims to compare the possible changes in management methods and calculations for event ingress out-with a turnstile system. With previous studies being conducted at live events, it could be suggested that these results would be subject to greater variances (Swetnam, 2004, p24) associated with the specific event at study. Through comparative analysis of the empirical quantitative data collected; with focus groups and previous studies on active events, the potential variations can be observed and presented (Sharp et al, 2002, p.48). The gathering of empirical data during a study is required to validate the results and assembling evidence through quantitative and qualitative research will be conducted. As outlined by Dawson (2009, p14), qualitative date is the gathering of opinion; based on attitudes, behaviors and experience. Quantitative research though is described as objective (Fox et al. 2007, p.11), the gathering of quantifiable or measurable facts and figures directly reflecting what is seen in the real world.
Potential outcomes and Limitations
Were variances found to that of previous study on the subject, this would present the possibility of more accurate calculations or an indication that further study is required on a larger scale (Walliman, 2011). As a part-time, distance learning student, it is also important to understand the limitations of the study and self, (Fox et al, 2014). It was understood from the start of the study that the variations in ingress designs were vast and the management methods would match these variations. To allow a study to be conducted, an understanding of what is involved during a study is required; Swetnam (2004, p.11) suggests that “From an amorphous, vague idea must emerge a sharp, precise plan”. Along with sharpening, comes a requirement to set limitations to the study. Sachdeva (2009, p15) recommends that documenting the scope and limits of the study would be prudent.
Consideration of the variables that could influence the ingress operation (Swetnam, 2004, p24), weather, lighting, noise levels, equipment, staff training must be accounted for and recognised. The student must also consider the possibility of bias (O’Gorman & MacIntosh, 2014) on their part as well as the constraints of time (Breach, 2009). For this study, it will be assumed that the customers will arrive at the point of ingress in a safe and organised manner and the process will conclude when they have past the last member of staff involved in the ingress process. This is in line with the intentions of the study to ascertain the calculations and management methods of ingress; not the arrival profile (Still, 2013, p152) or queue theory Erlang’s (1909).
Capacity ingress
The research in this area will be gathered from primary (O’Gorman & MacIntosh, 2014, p81) sources. Primary, qualitative data will be gathered from observations of event ingress stages and quantitative data by the venues ticketing company; recording the entry rates in set periods of time. Were the Green guide (DCMS, 2008, p62) provides an upper limit rate, the study with follow suit; considerations to reduce this rate, would follow. As such, the study must be provided with favourable settings; that allow the best attainable outcomes (O’Gorman & MacIntosh, 2014, p164).
A venue was chosen to conduct the study and consent was obtained from the operators. The venue allows the criteria for the collection of data (Walliman, 2011, p39) to be achieved; one of the most active in the country, the variety of events covered the desired audience profiles, the ticket scanning system was robust, the venue had a strong Wi-Fi signal (reducing network drop out), the entrances were sheltered with sufficient lighting conditions. The stewarding operators were separated into ticket scanning and searching, with the staff experienced in the operation of the scanners. Were the study could be conducted across a variety of event spaces; indoor and outdoor, large and small, this could prove challenging in achieving reliability and dependability in results (Kuada, 2012, p115).
A total of 41 events were chosen for study; over a 4-month period. The chosen events had to match the required criteria (Fox et al, 2014, p80) to be considered; attract a sizable attendance, have a history of early arrivals and queuing and cover the audience types predetermined by the student. The collection of entry data would be reviewed post event, allowing the focus on event days to be direct observation of the scanning operation (Dawson, 2009, p32). Observation notes would be collected during the period of observation; including use on scanning equipment, customer interaction, failure of systems, integrity of queuing and standard event operations (Swetnam, 2004, p57). The combination of both sets of data would be collated after the 4-month observation period; preventing bias or predetermined conclusions during the study (Fisher, 2010, p137).
The customer groupings are based on the most dominant factor of the event or those attending (Blaxter et al, 2006, p44). The categories chosen where; Rock Music Event, Dance Music Event, All Seated Event, Mature Audience Event, Younger Audience Event, and Family Audience Event. There was a final test conducted, that of the scanning equipment. This was to provide an understanding of the potential scan rate (Crabtree & Miller, 1999, p59), without customer interaction.
Focus group participants
Through the observations of the ticket scanning operation, it was notable that the searching operation was not an equivalent balance with the scanning positions. There was also a reduction in control measures when approaching search area (Erlang’s, 1909), were most events entailed of a reoccurring search protocol. The decision was taken to reduce the influence of independent variables (Fox et al, 2014, p89) and control the dependent variables (Veal, 2006, p338). These variables would include; lighting, weather, temperature, underfoot conditions, surroundings and remove were possible, distractions. To achieve this, the conclusion was reached to remove the study from the environment of a live event. A neutral environment would be sought, were the conditions could be controlled.
To conduct the experiments on rates of through-put with differing search protocols, a controlled office environment was chosen. This provided; suitable lighting, comfortable temperature, carpeted, flat flooring, not subject to the elements, distraction and time restrictions free (Crabtree & Miller, 1999, p99). Two focus groups were formed (Barbour, 2007) to perform the tests; one group of 11 males and another of 11 females. These grouping were to match the socially accepted routine (BSIA, 2015); males searching males and females searching females. The 22 participants were contacted out of a pool of 495 licenced staff and volunteered (Kuada, 2012, p95); 9 rejected the offer to participate. The search protocols chosen were; (i) Identification or accreditation check, (ii) Profiled or random search, (iii) Cursory body search, (iv) Cursory bag search, (v) Comprehensive bag search, (vi) Comprehensive body search, (vii) Handheld metal detection wand, items not removed, (viii) Handheld metal detection wand, items removed, (ix) Hand held metal detection wand and body search, items removed, (x) Walk through metal detector archway, items not removed, (xi) Walk through metal detector archway, items removed. The use of x-ray machines within the events industry is limited, with specialist training required. As such, will not be included in the study.
Materials
To assist in the analysis of the searching protocols, a Sony Camcorder and GoPro Hero 3 Plus were used to capture the male searchers. This was to allow times to be recorded; although was later not required, as times were recorded manually at the time. Due to this, the second focus group; females, where not recorded (Appendix D, Q26). Times were captured via the stopwatch on an Apple IPad. During the observation of the ticket scanning operation, a small note pad and pen was used; later transferred to Microsoft Word document. All material was stored on an Apple Macbook Pro, were the dissertation was written on Microsoft Word and tables and charts created on Microsoft Excel.
Design
The study has been designed, were the collection of empirical data follows a positivist paradigm (Lindsay, 2007, p42) approach. This is described by Kaboub (2008) as “The positivist paradigm asserts that real events can be observed empirically and explained with logical analysis. The criterion for evaluating the validity of a scientific theory is whether our knowledge claims (i.e., theory-based predictions) are consistent with the information we are able to obtain using our senses.”
Ethics
It is understood that the focus groups consent is required, with participation in the data collection and inclusion in publication of the study; the research will “intrude on people’s lives” (Dawson, 2009, p.149) and should be treated with respect. A suitable environment was chosen, refreshments provided, toilet facilities available and briefing conducted on the experiment to be conducted; all participants indicated they found the environment suitable (Appendix C, Q24; Appendix D, Q24), that they were willing to participate in the focus group (Appendix C, Q20; Appendix D, Q20) and understand the tasks asked of them (Appendix C, Q19; Appendix D, Q19). During the study, the student will comply with Buckinghamshire New Universities ethical policy (Bucks new university, 2016). With primary data being sourced from the real world, consideration must be given to ensure that commercially sensitive information in relation to the ticketing system, venue operation, security management, training or ticket sales is not compromised. As such, no company or product names will be included within this study (O’ Gorman & MacIntosh, 2014, p194.)
Results
Entry systems
The quantitative date collected (Fox et al. 2007, p.11) for the ingress capacities for the events studied has been provided by primary source (O’Gorman & MacIntosh, 2014, p81); in the case of this study, the ticketing agency for the venue. The collected data has been divided into the sub groups or audience profiles.
An assessment was completed of the ticket entry scanning system. This removed the uncertainty of operators proposed rates (Breach, 2009, p59) and an appreciation of operator use (Appendix A, Chart T1). With a variance of 21 tickets scanned per minute, this proposes an appreciation of the greater limits the system can achieve and that operator use can influence the results.
Following the guidance from the guide To Safety at Sports Grounds, the upper limit result for each sub group will be used as the results. An average will be provided to allow comparison and the variation per minute. A full provision of the empirical data can be obtained in Appendix A.
The upper limit results; recorded in persons per 1 minute.

Table R1
As the collection of data was electronic; via a primary source, this allowed the focus during the events to be studied to be that of observation (Dawson, 2009, p32). A level of understanding of adjustments to the entry scanning operation was attainable, be this physical or psychological (Walliman, 2011, p130) on the part of the venue staff or the customer.
During the restricted observation opportunities for the Dance Events, a lower entry rate result was recorded than the other sub groups (Appendix A, Chart D1). The results were influenced by the security measures implemented by the venue. Due to this; although included in the study, further study of entry rates at this genre of event is required.
The upper limit for the Mature Audience entry has been rejected from the data assemblage (Appendix A, Chart M1). During the period of observation, there was four spikes of increased entry rate. To achieve the results recorded the entry staff had to alter their standard operation; reducing verbal customer interaction and the handling of tickets increased to groups and less single ticket. The limit submitted has been taken from the upper level results, after the spikes have been removed.
The decision has been reached to accept the upper limit results for the Younger Audience; although this is higher than the rest of the sub groups observed (Appendix A, Chart Y1). It was observed over the course of the sub group events that customer vocal interaction was less and customers were more focused on gaining quicker entry. Were parents or guardians attended with younger customers, there was a higher percentage of batch ticket presentation; allowing for a quicker scan rate. Unlike the Mature Audience results, this increase has been accepted, due the frequency of the occurrences and the possibility to achieve this rate consistently with an understanding of the customer profile.
As with the Mature Audience, the provided upper level rate for the Family Event has been reduced (Appendix A, Chart F1). Observations allowed an understanding of the measures implemented to achieve the spikes in entry rate. This was out with the standard service provided; requiring a reduction in vocal customer interaction and prompting from supervisory staff.
Within the 41-events studied, there were 2-events not included in the data gathered. The first one was due to the door times being brought forward by one hour; the recording of entry data was not updated to match this change, failing to record the entrance rates. The second event, was due to a power failure before the doors opened. This caused the ticket scanning system to malfunction and the tickets for the event were checked manually by the door staff.
Security consideration
Following the guidance from the guide To Safety at Sports Grounds, the upper limit result for each security protocol will be accepted as the results. An average will be provided to allow comparison and the variation per minute. A full provision of the empirical data can be obtained in Appendix B. A survey was also conducted of the focus group members, to gain further understanding of the thought processes in participants when conducting security searches; Appendix C and D.
During both sessions with the separate focus groups, a high level of service and performance was observed. It is also noted that the participants, adopted differing personae of customers that they perceive in the real world. This did not detract from the delivery of the experiment; the realism it brought enhanced the sessions.
The upper limit results; recorded in persons per 1 minute.
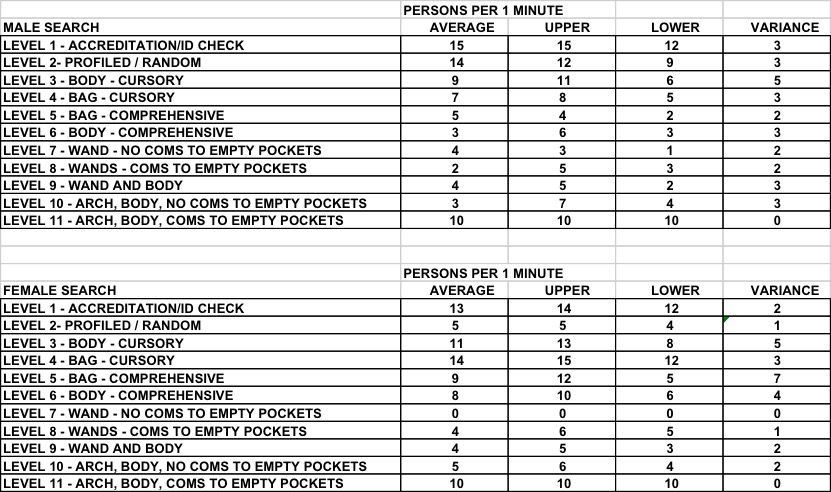
Table S1
As with the entry data collection, the observations of the focus groups have assisted in ensuring a representative set of results have been gathered and were intervention has been required this was taken. A full table of the results are shown in Table S2 & S3.
During the Male, identification and accreditation check (Appendix B, Table MS1), 3 of the participants were above average in the processing of persons. On discussion after the experiment, the 3 participants mentioned that they could have performed better in their checks and had rushed through the checks. They believed that because this was the first protocol of the session, they had been caught up in being competitive. This was also noted by the observer.
The Female, Hand held metal detection wand – Items not removed (Appendix B, Table FS7), has been recorded as a non-result. During the process of conducting the protocol, the group started discussing the process and paused the test. They expressed and it was noted, due to all having brought a handbag; as requested, they did not have anything in their pockets to be found. It was suggested that this is common when attending a social engagement with a bag, or if not carrying a bag, the carrying of items would be limited.
The results of the Body searches differed between Male and Female (Appendix B, Table MS2, Table MS3, Table MS6) compared to (Appendix B, Table FS2, Table FS3, Table FS6). During the profiled and cursory searches, the males performed quicker compared to the females, but slower when conducting the comprehensive body search. During the observation and conversations with the participants, it was indicated; males are more adapt at performing body searches, due to this being their main function. The female participants indicated that they were less experienced in conducting body searches. When conducting a comprehensive body search, the males conducted a more detailed search compared to the females; due to clothing choices and layers.
When conducting the bag searches, the opposite was observed to the body searches (Appendix B, Table MS4, Table MS5) compared to (Appendix B, Table FS4, Table FS5). The females presented a more comprehensive understanding and delivery of the search process, compared to the males.
Male Searchers

Table S2
Female Searchers

Table S3
Customer service.
To discover the influence of customer service on the ingress period of an event, it can be conceivable to study the qualitative data collection; through the observation of patrons, though this would be a greater work than this study can provide.
Comparing the quantitative results to the variations in the operation can provide a gauge to the impetuses of customer service. As previously alluded to in the study, all entry points where measured with a continuous flow of customers to all entry points. During this period, each member of staff would constantly have a customer to serve and a queue formed to feed the server. The role of the supervisors was to ensure the queues did not get too long and customers were kept longer than needed. In speeding up the service; supervisors, would encourage the service points to scan faster and “speed up”.
Observations across the events and study, presented a reduction in customer interaction, with an increase in service pace. The venue supports a high level of customer service and engagement; greeting customers, smiling, being pleasant, wishing them well, passing on basic event information and directions. On command to process faster or natural haste, the customer interaction is reduced to basic requests; request tickets and to move into the venue. Although, not what the venue aspires to, a balance in customer service and waiting times is considered as a compromise. The quantitative empirical data, reproduces the modifications of customer flow rate.
To assist in provide a stable view of the variations; the average flow rates across the observed timeframe will be compared to the upper limit rate of each event. This allows for an understanding in the percentage reduction, customer service levels may have.
Rock Audience = 25 – 57%; Dance Audience = 40 – 67%; All Seated Audience = 20 – 50%; Mature Audience = 20 – 67%; Younger Audience = 20 – 46%; Family Audience = 30 – 60%.
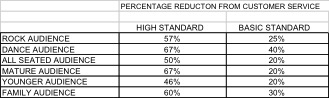
The variation provides an understanding of the impact the quality of customer service can have on scanning through-put rates. Were, the customer service levels being high; prolonged customer engagement, the higher limit of the reduction is observed. For events were customers service was a basic form of greeting and pleasantries; the lower percentage of reduction can be considered.
Results combination
Were, The Guide to Safety at Sports Grounds (2008), suggests an upper limit is considered, tables R1, R2, R3 provide this. Each table works as a standalone, or can be combined; were the lower flow rate between R1 and R2 would be the correct rate. The inclusion of table R3, proposes a reduction in flow rates; based on customer service requirements.
Entry system rates by audience genre

Table R1
Security consideration rates by protocol
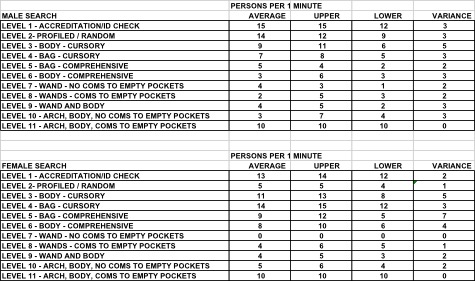
Table R2
Customer service influence by percentage

Table R3
Example 1
Rock Audience, no security feature = 8 persons per minute. Possible reduction of 25 – 57% for customer service.
Rock Audience, high percentage of males attending, random/ profiled search = 8 persons per minute (the lower figure is used, as this is the slower part of the process). Possible reduction of 25 – 57% for customer service.
Example 2
Mature Audience, no security features = 12 persons per minute. Possible reduction of 20 – 67% for customer service.
Mature Audience, high percentage of females, random/ profiled search = 5 persons per minute. Possible reduction of 20 – 67% for customer service.
Discussion
Having conducted the study of the ingress phase of an event; out-with a turnstile system, a comparison of the findings can be made with (DCMS, 2008) along with (HSE, 1993). Having been the predominant referencing guides for crowd and event managers for the past 18 years, is the ingress calculations provided and considerations as pertinent as they once were. The finding suggests that in some cases they are and on other occasions more accurate calculations can be sought after if required.
The study has separated the through-put calculations and management requirements, from the larger models, such as the “RAMP Analysis” (Still, 2013). The ingress process has been separated from the arrival stage; to allow more detail and due attention. Following in the trail of previous studies (Kemp et al, 2004; Kemp et al, 2007), through observation and due-diligence, the key elements that form the ingress stage have been defined; entry systems, security considerations and customer service. The latest information provided in the Purple Guide (thepurpleguide, 2017, 3.14 Fig1) goes some way to assist practitioners understand the requirements, for planning an ingress system and management solution. The findings of the study suggest that more accurate calculations can be provided for through-put rates out with a turnstile system were required.
To achieve the rates included within the study results, the systematic and efficient delivery of customers is required as indicated by Erlang’s (1909). By considering the DIM-ICE meta model provided by Still (2013), the possibility to do this at an event is possible and should be considered in the planning stages. Were, a defined management plan and solution is not implemented, the calculations and management of the ingress stage will not solve inherent design flaws.
As suggested by the study, the security considerations for an event, cannot be separated from the ingress process and form an integral part of the structure (MI5, 2017). Elias (2009), provides us with an insight into the balancing of security requirements and through-put rates; a miscalculation either causes a backlog or ineffectual security measures and the risks this bring. Thought should also be lent to the ability, training and commitment to the staffing used, were Getz (2007) indicates that this could influence the rates achieved.
The final; and possible the most alluding stage, is customer service. The Health and Safety Executive (2000), advised that good customer relations are important to having a successful event. The anticipation of customer requirements (Hudson & Hudson, 2013) and Cope et al (2011) illustrates the length that customer dependant industries are striving for. The implementation of high levels of customer service and engagement must be accounted for in the measurements and management solutions for an ingress system. Miscalculations in this provision, will quickly change hard work and planning into bad reviews and complaints (Eggemeier, 2016) and in worst case scenario, loss of life (Upton, 2007).
Were the study has provided comparable ingress calculations for consideration, the student believes that further investigation is required, to encapsulate the short falls of the study (Sachdeva, 2009); due to time constrains, the ability to vary the events and locations studied and range of events. As already mentioned, the results for Dance music events was achieved on a limited scale and influenced by security measures. Inclusion of outdoor events and festivals would provide a well-rounded indication of current through-put rates and security measures. The influence of customer service, should be considered for an in-depth study, providing a greater appreciation for the aspects of the service and how this could impact on ingress measures and management solutions.
Referencing
Abelugba, D. (2012) Operational Plan for the delivery of Crowd Management & Security to Love Box – June 2012 [online]. TowerHamlets. Available from: http://democracy.towerhamlets.gov.uk/documents/s27401/ [Accessed 5 January 2017].
Arita, C. & Schadschneider, A., 2014. The dynamics of waiting: the exclusive queueing process. Transportation Research Procedia, 2, pp.87-95.
Arita, C. & Schadschneider, A., 2015. Exclusive queueing processes and their application to traffic systems. Mathematical Models and Methods in Applied Sciences, 25(03), pp.401-422.
Barbour, R. (2007) Doing Focus Groups. London: Sage Publications Ltd.
BBC News (2016) Common People: ‘Horrendous’ festival queues complaints [online]. BBC News. Available from: http://www.bbc.co.uk/news/uk-england-hampshire-36412053 [Accessed 14 November 2016].
BBC News (2015) Paris attacks: What happened on the night [online]. BBC News. Available from: http://www.bbc.co.uk/news/world-europe-34818994 [Accessed 10 February 2017].
BBC News (2016) Rio Olympics 2016: Organisers apologise for long queues [online]. BBC News. Available from: http://www.bbc.co.uk/sport/olympics/36998580 [Accessed 10 February 2017].
BBC News (2016) Why are airport security queues so long in the US lately? [online]. BBC News. Available from: http://www.bbc.co.uk/news/world-us-canada-36316366 [Accessed 10 February 2017].
BC Sheriff. (2003) Arrest and search techniques study guide [online]. BCSheriff. Available from: https://www.bcsheriff.org/pdfs/StudyGuide.pdf [Accessed 9 March 2017].
Blaxter, L. Hughes, C. Tight, M. (2006) How to Research Third Edition. Berkshire: Open University Press. pp44.
Blaxter, L. Hughes, C. Tight, M. (2006) How to Research Third Edition. Berkshire: Open University Press. pp221.
Breach, M. (2009) Dissertation Writing for Engineers and Scientists, Student Edition. Harlow: Pearson Education Limited.
Breach, M. (2009) Dissertation Writing for Engineers and Scientists, Student Edition. Harlow: Pearson Education Limited. pp59.
BSIA. (2015) Code of practice for security searches [online]. BSIA. Available from: https://www.bsia.co.uk/Portals/4/Publications/231-security-searches-cop.pdf [Accessed on 27 January 2017].
Bucks new university. (2016) Research ethics and integrity [online]. Bucks new university. Available from: http://bucks.ac.uk/research/research_ethics_integrity/ [Accessed 20 December 2016].
Bukowski, B. (2015) Customer Service: The New Security Officer Imperative [online]. SecurityMagazine. Available from: http://www.securitymagazine.com/articles/86746-customer-service-the-new-security-officer-imperative [Accessed 12 February 2017].
Cope, R.F., Cope III, R.F., Bass, A.N. Syrdal, H.A., (2011). Innovative knowledge management at Disney: human capital and queuing solutions for services. Journal of Service Science, 4(1), pp.13.
Crabtree, B. Miller, W. (1999) Doing Qualitative Research Second Edition. London: Sage Publications Inc. pp55.
Crabtree, B. Miller, W. (1999) Doing Qualitative Research Second Edition. London: Sage Publications Inc. pp99.
Dawson, Dr C. (2009) Introduction to Research Methods, A practical guide to anyone undertaking a research project, fourth edition. Oxford: How to Books Ltd. pp14.
Dawson, Dr C. (2009) Introduction to Research Methods, A practical guide to anyone undertaking a research project, fourth edition. Oxford: How to Books Ltd. pp32.
Dawson, Dr C. (2009) Introduction to Research Methods, A practical guide to anyone undertaking a research project, fourth edition. Oxford: How to Books Ltd. pp149.
DCMS (2008) The guide To Safety At Sports Grounds 5th Edition. Norwich: TSO Publishing.
DCMS (2008) The guide To Safety At Sports Grounds 5th Edition. Norwich: TSO Publishing. pp61.
Eggemeier, T. (2016) The Olympics Has a Customer Experience Problem [online]. 22 August. Available from: http://blog.genesys.com/olympics-customer-experience-problem/ [Accessed 12 February 2017].
Elias, B., (2009) Airport passenger screening: Background and issues for Congress (No. R40543).
Elias, B., (2009) Airport passenger screening: Background and issues for Congress. pp6. (No. R40543).
Erlang, A.K., (1909) The theory of probabilities and telephone conversations. Nyt Tidsskrift for Matematik B, 20(33-39), pp.16.
Fisher, C. (2010) Researching and Writing a Dissertation An essential guide for business students Third edition. Page 137. Pearson Education Limited. Essex. England
Fischer, H.J., Konnecke, R. Ordon, C., (2001) ET: Neue Zugangsbarrieren durch Chipkartenlesegerate?. NAHVERKEHR, 19(6), pp.34-39.
Fox, D. Gouthro, MB. Morkabati, Y. Brackstone, J. (2014) Doing Events Research From theory to practice. Oxon: Routledge.
Fox, D. Gouthro, MB. Morkabati, Y. Brackstone, J. (2014) Doing Events Research From theory to practice. Oxon: Routledge. pp80.
Fox, D. Gouthro, MB. Morkabati, Y. Brackstone, J. (2014) Doing Events Research From theory to practice. Oxon: Routledge. pp89.
Getz, D. (2007) Event studies theory, research and policy for planned events. Oxford: Elsevier Ltd. pp 196.
Hall, S. Cooper, W. Marciani, L. McGee, J. (2012) Security management for sports and special events – an interagency approach to creating safe facilities. Champaign IL: Human kinetics.
Harrison, M., Hedges, C. Sims, C., (2006) Practice Advice on Search Management and Procedures. National Policing Improvement Agency (NPIA).
Health and Safety Executive (1993). The Event Safety Guide, A guide the health, safety and welfare at music and similar events. [s.l.]. Norwich: HSE Books.
HSE (1999). The Event Safety Guide, A guide the health, safety and welfare at music and similar events. [s.l.]. Norwich: HSE Books.
HSE (1999). The Event Safety Guide, A guide the health, safety and welfare at music and similar events. [s.l.]. Norwich: HSE Books. pp21.
HSE (1999). The Event Safety Guide, A guide the health, safety and welfare at music and similar events. [s.l.]. Norwich: HSE Books. pp159.
HSE. (2000) Managing crowds safely: A guide for organisers at events and venues. Norwich: Crown copyright.
Henderson, B. Sabur, R. (2016) Nice terrorist attack on Bastille Day: everything we know so far on Monday [online]. Telegraph. Available from: http://www.telegraph.co.uk/news/2016/07/15/nice-terror-attack-on-bastille-day-everything-we-know-so-far-on/ [Accessed 10 February 2017].
HMSO. (1990) Guide to Fire Precautions in Existing Places of Entertainment and Like Premises. London: HMSO Books.
HMSO. (1990) Guide to Fire Precautions in Existing Places of Entertainment and Like Premises. London: HMSO Books. pp44.
Hopp, W., Spearman, M. (2008) Factory Physics. Boston: McGraw-Hill.
Hudson, S., Hudson, L. (2013) Customer service for hospitality and tourism. London: Goodfellow publishers limited.
Huggler, J. Rothwell, J. Burke, L. Allen, N. Palazzo, C. (2016) Berlin terror attack: Tunisian suspect was investigated over earlier terror plot [online]. Telegraph. Available from: http://www.telegraph.co.uk/news/2016/12/20/berlin-market-attack-suspect-named-23-year-old-asylum-seeker/ [Accessed 10 February 2017].
IATA. (2010) SECURITY ACCESS & EGRESS Implementation Guide: IATA 1st edition [online]. IATA. Available from: https://www.iata.org/whatwedo/stb/Documents/pf-guide-security-2012.pdf. [Accessed 10 March 2017]
IQ Mag (2016) ‘AIRPORT-STYLE’ SECURITY AT WIRELESS 2016 [online]. IQ. Available from: https://www.iq-mag.net/2016/07/airport-style-metal-detectors-wireless-2016/#.WPOf0seAxo4 [Accessed 10 February 2017].
Kaboub, F. (2008). Positivist paradigm. Leong, Encyclopedia of Counselling, Thousand Oaks, pp.786-787.
Kemp, C., Hill, I., Upton, M. (2004) A comparative study of crowd behaviour at two major music events. Cambridge: Entertainment technology press ltd.
Kemp, C., Hill, I., Upton, M. (2004) A comparative study of crowd behaviour at two major music events. Cambridge: Entertainment technology press ltd. pp24.
Kemp, C., Hill, I., Upton, M. (2004) A comparative study of crowd behaviour at two major music events. Cambridge: Entertainment technology press ltd. pp44.
Kemp, C., Hill, I., Upton, M. (2004) A comparative study of crowd behaviour at two major music events. Cambridge: Entertainment technology press ltd. pp34-42.
Kemp, C., Hill, I., Upton, M., Hamilton, M. (2007) Case Studies in Crowd Management. Cambridge: Entertainment technology press.
Kemp, C., Hill, I., Upton, M., Hamilton, M. (2007) Case Studies in Crowd Management. Cambridge: Entertainment technology press. pp66.
Kemp, C., Hill, I., Upton, M., Hamilton, M. (2007) Case Studies in Crowd Management. Cambridge: Entertainment technology press. pp78.
Kemp, C., Hill, I., Upton, M., Hamilton, M. (2007) Case Studies in Crowd Management. Cambridge: Entertainment technology press. pp118.
Könnecke, R. & Schneider, V., (2014) BaSiGo: Safety of Large Scale Events–Crowd Flow Modeling of Ingress and Egress Scenarios. Transportation Research Procedia, 2, pp.501-506.
Kuada, J. (2012) Research Methodology A Project Guide for University Students. Frederiksberg C: Samfundslitteratur. pp95.
Kuada, J. (2012) Research Methodology A Project Guide for University Students. Frederiksberg C: Samfundslitteratur. P115.
Legislation.gov.uk. (2017) Data Protection act 2003 [online]. legislation.gov.uk. Available from: http://www.legislation.gov.uk/ukpga/1998/29/contents [Accessed 28 March 2017].
Legislation.gov.uk. (2017) Private Security Industry Act 2001 [online]. legislation.gov.uk. Available from: http://www.legislation.gov.uk/ukpga/2001/12/section/4 [Accessed 12 February 2017].
Lindsay, B. (2007) Health and Social Care: Knowledge and Skills. Understanding Research and Evidence-based Practice. Devon: Reflect Press Ltd. pp42.
Medhi, J. (2003) Stochastic Models in Queueing Theory. San Diego: Academic Press.
Mills, J. (2014) Crowd Management Plan (V1) Mutiny in the Park 2014 [online]. democracy.portsmouth.gov.uk. Available from: http://democracy.portsmouth.gov.uk/documents/s3845/Item%204%20-%20Crowd%20management%20plan.pdf [Accessed 5 January 2017].
MI5. (2017) Threat Level [online]. MI5. Available from: https://www.mi5.gov.uk/threat-levels [Accessed 12 April 2017].
O’Gorman, K. MacIntosh, R. (2014) Research Methods for Business & Management: A Guide to Writing Your Dissertation. London: Goodfelllow Publishers Limited.
O’Gorman, K. MacIntosh, R. (2014) Research Methods for Business & Management: A Guide to Writing Your Dissertation. London: Goodfelllow Publishers Limited. pp81.
O’Gorman, K. MacIntosh, R. (2014) Research Methods for Business & Management: A Guide to Writing Your Dissertation. London: Goodfelllow Publishers Limited. pp164.
O’Gorman, K. MacIntosh, R. (2014) Research Methods for Business & Management: A Guide to Writing Your Dissertation. London: Goodfelllow Publishers Limited. pp183.
O’Gorman, K. MacIntosh, R. (2014) Research Methods for Business & Management: A Guide to Writing Your Dissertation. London: Goodfelllow Publishers Limited. pp194.
Rapiscan Systems. (2017) products [online]. Rapiscansystems. Available from: http://www.rapiscansystems.com/en/products [Accessed 10 March 2017].
Saaty, T. (1961) Elements of Queueing Theory With Applications. Dover Publ. pp, W., Spearman, M., 2008. Factory Physics. McGraw-Hill, Boston.
Sachdeva, J,D. (2009) Business research methodology. Mumbai: Himalaya Publishing House PVT.Ltd. pp15.
SGSA. (2016) The Guide To Safety At Sports Grounds (Green Guide) 6th Edition [online]. SGSA. Available from: http://www.safetyatsportsgrounds.org.uk/news/guide-safety-sports-grounds-green-guide-6th-edition [Accessed 27 November 2016].
SIA (2014) Specification for Learning and Qualifications for Door Supervisors: August 2014 [online]. SIA. Available from: https://www.sia.homeoffice.gov.uk/Documents/training/modules/sia_ds_specification.pdf [Accessed 9 March 2017].
SIA. (2017) Security Industry Authority About Us [online]. SIA. Available from: https://www.sia.homeoffice.gov.uk/Pages/about-us.aspx [Accessed 12 February 2017].
SIA. (2008) Security at events Guidance on the Private Security Industry Act 2001 Updated February 2008 [online]. SIA. Available from: https://www.sia.homeoffice.gov.uk/Documents/licensing/sia_security_at_events.pdf [Accessed 12 February 2017].
SIA. (2017) Required Qualifications for Door Supervisors [online]. SIA. Available from: https://www.sia.homeoffice.gov.uk/Pages/training-qualifications-ds.aspx [Accessed 13 February 2017].
Seidenstat, P. Splane, F. (2009) Protecting airline passengers in the age of terrorism. LLCCalifornia: ABC-CLIO.
Seidenstat, P. Splane, F. (2009) Protecting airline passengers in the age of terrorism. LLCCalifornia: ABC-CLIO. pp85.
Skidata. (2017) Arenagate [online]. Skidata. Available from: https://www.skidata.com/en/products-services/products-for-arenas-leisure/access-readers-turnstiles/arenagate/ [Accessed 10 March 2017].
Sharp, J., Peters, J., Howard, K. (2002) The Management of a Student Research Project, Third Edition. Auldershot: Gower Publications Limited. pp14.
Sharp, J., Peters, J., Howard, K. (2002) The Management of a Student Research Project, Third Edition. Auldershot: Gower Publications Limited. pp48.
Schell, T.L., Chow, B.G. Grammich, C., (2003) Designing airports for security: An analysis of proposed changes at LAX (No. RAND/IP-251). RAND CORP SANTA MONICA CA.
Still, G K. (2013) Introduction to crowd science. Florida: CRC Press.
Still, G K. (2013) Introduction to crowd science. Florida: CRC Press. pp7.
Still, G K. (2013) Introduction to crowd science. Florida: CRC Press. pp60.
Still, G K. (2013) Introduction to crowd science. Florida: CRC Press. pp118.
Still, G K. (2013) Introduction to crowd science. Florida: CRC Press. pp152.
Still, G K. (2013) Introduction to crowd science. Florida: CRC Press. pp163.
Still, G K. (2013) Introduction to crowd science. Florida: CRC Press. pp178.
Strege, S.M. & Ferreira, M.J., (2014) Modeling Occupant Ingress at a Secure Building and Using Field Measurements for Calibration. Transportation Research Procedia, 2, pp.807-812.
Swetnam, D. (2004) Writing your dissertation, how to plan, prepare and present successful work, 3rd edition. Oxford: How to Books Ltd. pp11.
Swetnam, D. (2004) Writing your dissertation, how to plan, prepare and present successful work, 3rd edition. Oxford: How to Books Ltd. pp24.
Swetnam, D. (2004) Writing your dissertation, how to plan, prepare and present successful work, 3rd edition. Oxford: How to Books Ltd. pp57.
The All England Lawn Tennis Club. (2015) TICKET HOLDERS’ GUIDE THE CHAMPIONSHIPS, WIMBLEDON MONDAY 29TH JUNE — SUNDAY 12TH JULY 2015 [online]. Wimbledon. Available from: http://www.wimbledon.com/pdf/2015_Ticket_Holders_Guide_v2.pdf [ Accessed 10 March 2017].
thepurpleguide. (2017) the purple guide to Health, Safety and Welfare at Music and Other Events [online]. thepurpleguide. Available from: http://www.thepurpleguide.co.uk [Accessed on 18 December 2016].
thepurpleguide. (2017) the purple guide to Health, Safety and Welfare at Music and Other Events. 3.14. Fig1 [online]. thepurpleguide. Available from: http://www.thepurpleguide.co.uk [Accessed on 5 January 2017].
The U.S Customs and Border Protection. (2015) U.S. Customs and Border Protection National Standards on Transport, Escort, Detention, and Search: October 2015 [online]. cbp. Available from: https://www.cbp.gov/sites/default/files/documents/cbp-teds-policy-20151005_1.pdf [Accessed 10 March 2017].
Ticketprinting. (2017) Ticket Security [online]. TicketPrinting. Available from: https://www.ticketprinting.com/Site/Ticket-Security.aspx [Accessed 13 November 2016].
Upton, M. (2007) From ancient Rome to rock ‘n’ roll: A review of the UK leisure security industry. Great Shelford: Entertainment Technology Press. pp111.
Upton, M. (2007) From ancient Rome to rock ‘n’ roll: A review of the UK leisure security industry. Great Shelford: Entertainment Technology Press. pp118.
Vass, H. & Szabo, Z.K., 2015. Application of Queuing Model to Patient Flow in Emergency Department. Case Study. Procedia Economics and Finance, 32, pp.479-487.
Veal, AJ. (2006) Research Methods for Leisure and Tourism: A Practical Guide Third Edition. Page 131.Essex: Pearson Education Limited. pp131.
Veal, AJ. (2006) Research Methods for Leisure and Tourism: A Practical Guide Third Edition. Page 131.Essex: Pearson Education Limited. pp338.
Vespasian Security. (2015) CROWD MANAGEMENT PLAN V1.0 [online]. Derbyshiredales. Available from: http://www.derbyshiredales.gov.uk/images/documents/Y/Y-Not_Crowd_management_Plan_2016.pdf. [Accessed 5 January 2017].
Vespasian Security. (2016) Crowd Management Plan (V1) LeeFest 2016 [online]. CDSsevenoaks. Available from: http://cds.sevenoaks.gov.uk/documents/s28266/Supplementary%2024%20Vespasian%20Security%20Leefest%202016%20Crowd%20Management%20Plan.pdf. [Accessed 5 January 2017].
Wakefield, A. (2003) Selling security the private policing of public space. Devon: Willan publishing. pp168.
Walliman, N. (2011) Research Methods the basics, what you can do with research. London: Routledge, London. pp39.
Walliman, N. (2011) Research Methods the basics, what you can do with research. London: Routledge, London. pp45.
Walliman, N. (2011) Research Methods the basics, what you can do with research. London: Routledge, London. pp130.
Walliman, N. (2011) Research Methods the basics, what you can do with research. London: Routledge, London. pp158.
Walker, D. (2006) The role of security in providing customer service [online]. Ifpo. Available from: http://www.ifpo.org/wpcontent/uploads/2013/08/Walker_Providing_Customer_Service.pdf [Accessed on 6 January 2017].
Williams, I. (2012) My Olympic Experience at London 2012 [online]. 16 August. Available from: http://jerichoconsulting.co.uk/my-olympic-experience-london-2012/ [Accessed 12 February 2017].
Yasara, O. (2009). Queuing Models and Capacity Planning. In O. Yasara, Queuing Methods in Health care management (pp. 348-356). San Francisco: Jossey-Bass.
Zeithaml, V.A., Berry, L.A. Parasuraman, A. (1993) “The nature and deterninants of customer expectations of service”, journal of Academy of Marketing Science, 21 (1)
END.